The Problem
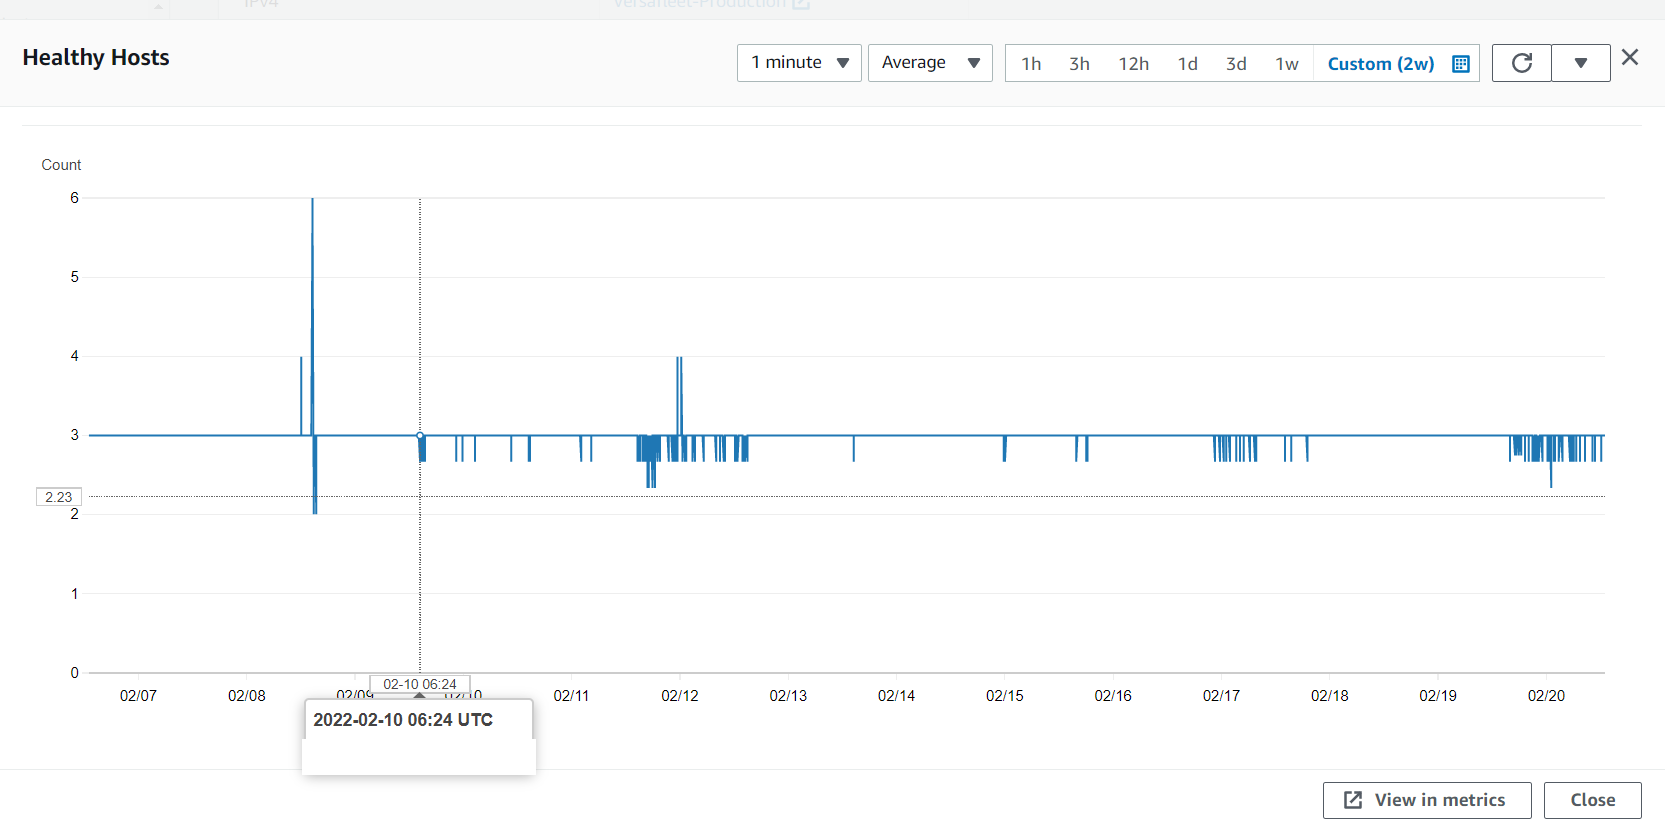
Some time back in February, I started to notice that my servers were becoming unstable. The graphs looked like this:
This is the HTTP 5XX graph. Notice that after the marked point, the appearance of HTTP 5XXs becomes consistent.

At the same time, the hosts start to become unstable. Unless there are scaling events, the line for this graph should be totally flat.

What in the world was going on?
First Steps
The first thing I did was to restart the servers. The problem went away immediately, so I decided it might be a one-time thing and just ignored it after determining that the usual CPU, memory, and disk usage metrics were fine.
However the problem came back again. So I looked through the code to look for changes made around the time the problem started, and found nothing obvious that could have caused such an odd issue. The only thing remotely close would be the addition of Sentry’s performance monitoring. So, I removed it.
Over the next two months, I added and removed the performance monitoring, and the error 500 issues came and went with it. I concluded that it might actually be Sentry’s performance monitoring that caused the issue, and assumed the problem was solved.
During this period of investigation, I noticed a pattern. The problem always started 24 hours after the server was booted up. There were a few other oddities as well. This issue didn’t always occur, and it could also occur 24 hours after a restart. This meant that I had to keep an eye on the server every 24 hours to ensure that it eventually reached a stable state.
Four Months Later…
The problem came back.
It clearly wasn’t related to Sentry’s performance monitoring.
Googling the problem was difficult. What search term would you use? The problem was generic, and there was no concrete error message to search for. Searching for things like “error 500 after 24 hours” led to nothing useful.
I decided to think deeper. The errors were not reaching the application at all, and AWS’s ELB metrics did not show any errors. So, the error must be between the ELB and application. The only things between that was Phusion Passenger and Apache. Off to the logs we go!
The Error Is Found
[ E 2022-08-06 08:10:50.0465 5191/T0 apa/Hooks.cpp:751 ]: Unexpected error in mod_passenger: Cannot connect to the Passenger core at unix:/passenger-instreg/passenger.Zbqhk9F/agents.s/core
  Backtrace:
     in 'Passenger::FileDescriptor Passenger::Apache2Module::Hooks::connectToCore()' (Hooks.cpp:343)
     in 'int Passenger::Apache2Module::Hooks::handleRequest(request_rec*)' (Hooks.cpp:622)
This was found in the Apache logs at /var/log/apache2.
Perfect, an error message would make the problem a lot easier to search for. Or so I thought.
The main solution found from a Google search mentioned that the passenger-instreg should be manually set. But it was already manually set.
Another solution given was that the contents of passenger-instreg was being deleted somehow. To me, this was a little strange because if there was something that would do this, it would be Phusion Passenger, but why would it sabotage its own operation?
Back To Error 500 Hell
So even with the error message, I was still lost.
- I decided to just update Phusion Passenger. It didn’t work.
- I decided to move the
passenger-instregsomewhere else. It didn’t work. - I checked the ownership of the
passenger-instreg. It was correct.
What else could I do?
- Maybe set up a cron to restart the servers every 23 hours?
Hey, if it works, it ain’t stupid, right? (actually, it’s still stupid) I was getting desperate.
The Cause Is Found
I decided to search for the error message once again. I eventually came across this issue on Phusion Passenger’s Github: https://github.com/phusion/passenger/issues/2235
To be honest, I don’t remember how I found it. The title of the Github issue had little to do with the error message, but I found it anyway.
Logrotate. I have no idea why logrotate would cause Apache and Phusion Passenger to crash, but it does. It now made sense why the errors started after 24 hours, but it didn’t explain the random nature of it.
copytruncate was suggested as a way to avoid the problem, but guess what? It didn’t work! Of course it didn’t, why would things be so easy?
The Solution
At this point, I was really tired with struggling with this issue. It’s been 7 months at this point, and it prevented me from ever being relaxed about the state of the servers.
So, since the error was related to Apache, I just swapped to Nginx. Problem solved.
The end.
Well, not really. Migrating from Apache to Nginx meant that some defaults were different. Fortunately, most settings worked fine with their defaults, except for one setting: client_max_body_size. On Apache, the default is unlimited on older versions, and 1gb on newer versions. On Nginx, the default for this is 1mb. That’s really small in this day and age, so some file uploads resulted in errors on the server.
After that was fixed, the servers have been running buttery smooth. A huge load off my mind.
Comments